Admin Dashboard - SEC
Business intelligence dashboards are used to track KPIs, metrics, and other key data points relevant to a business, department, or specific process. Through the use of data visualizations, dashboards simplify complex data sets to provide users with at a glance awareness of current performance.
IP Professionals use dashboards to quickly gain insights into the most important aspects of their data. They get real time insights and competitive analyses, and use them to identify items that require urgent action, streamlining workflows and properly purposing resources.
In this project, the goal was to develop a business intelligence dashboard for Swaziland Electricity Company's generation department. Sub goals included;
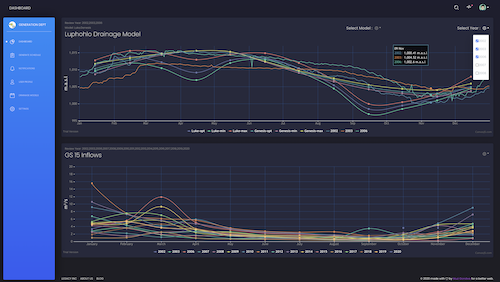
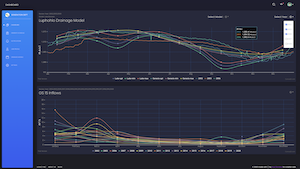
- Provide a platform where the department will be able to visualize their data by displaying metrics, graphs, gauges, maps, percentages and comparisons of all the daily collected information.
- This data include dam levels, water inflow, daily generated electricity units etc.
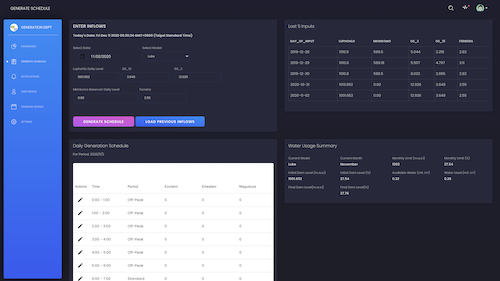
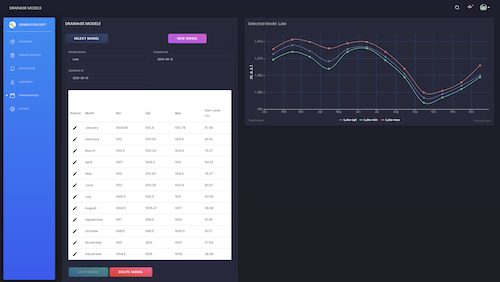
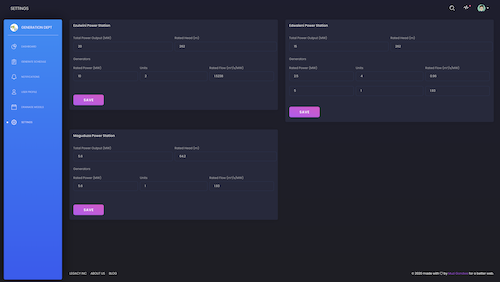
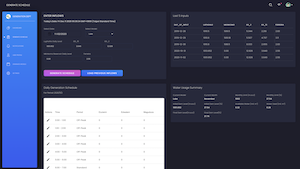
- In this platform, users are also able to create power generation schedules for the three power stations operated by the company. The process of scheduling is controlled by a draingae model which determines how the dam, which provide water to the whole cascaded system, is utilized to ensure that water is availabe through out the whole year
- The back end is powered by Express.js , a back end web application framework for Node.js and the data is stored in MongoDB. The back-end server is currently hosted in Heroku
- We used React.js for the front end, with Context Api, a component structure provided by the React framework, which enables us to share specific forms of data across all levels of the application (state management). The back-end server is currently hosted in netlify